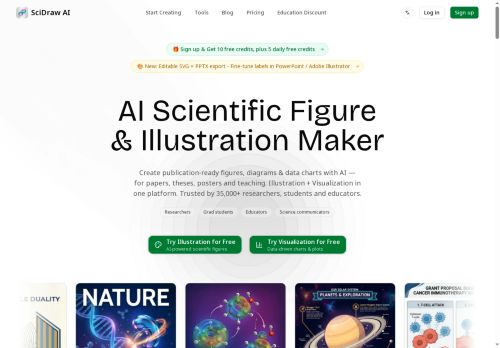
About SciDraw AI
It creates data-driven charts from CSV/Excel inputs and can export editable SVG and PPTX files for further editing in Illustrator, PowerPoint, Figma, or Inkscape.Journal style presets (Nature, Science, Cell, PLoS, ACS) and export formats (PNG, PDF, EPS, TIFF) support manuscript, thesis, poster, and slide requirements.
scidraw ai can generate Python matplotlib/seaborn code for reproducible plots and includes accessible color palettes such as Okabe–Ito for colorblind-friendly visuals.Built-in templates cover graphical abstracts, mechanisms, pathways, workflows, and textbook-style illustrations to streamline figure creation for publications and teaching.
Key Features
- Convert text prompts, hand-drawn sketches, or uploaded images into publication-ready figures with multi-round refinement and editable labels
- Create data-driven charts from CSV and Excel inputs
- Export editable SVG and PPTX files and export raster/vector formats (PNG, PDF, EPS, TIFF)
- Generate Python matplotlib/seaborn code for reproducible plots and provide accessible color palettes (Okabe–Ito)
- Built-in templates for graphical abstracts, mechanisms, pathways, workflows, and textbook-style illustrations
Use Cases
- Produce publication-ready scientific figures and graphical abstracts from text prompts, sketches, or images using SciDraw AI's journal style presets and colorblind-friendly palettes, ready for submission without manual design work
- Turn CSV or Excel spreadsheets into data-driven, publication-quality charts and heatmaps, export editable SVG/PPTX for presentations, and obtain reproducible Python plotting code for sharing and version control
- Convert rough sketches or experimental images into polished multi-panel figures with consistent formatting and accessible palettes, then export editable vector files for last-minute edits and compliance with journal figure specifications
Who is it for?
- Researchers
- Graduate students
- Educators
- Science communicators
- Manuscript authors
- Thesis and dissertation authors
- Poster and slide presenters
- Data analysts and computational scientists
- Scientific illustrators and designers
Based on 9 verified user reviews — Average rating: 4.33/5

@barbaramurphy2995
TurkeyReliable enough for production drafts. I edit the output, but the first pass is strong.

@geraldsanders9177
TurkeyThe output quality improved after I wrote better prompts. Highly usable.

@jordanhill191
TurkeyHızından etkilendim. Gerçek bir projede denedim ve gayet iyi dayandı.


@judypeterson7199
TurkeyArayüz sezgisel. Denediğim benzer araçlara göre öğrenmesi daha kolay.

@melissanguyen4469
TurkeyWorks smoothly on desktop. Would love more export options, but the core experience is good.
More Data visualization AI Tools
Explore other data visualization tools with user ratings, pricing details, and in-depth descriptions. Updated regularly by our editorial team.