
About aiboxplot
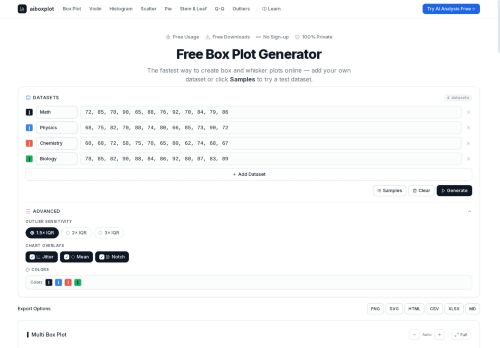
aiboxplot creates box-and-whisker plots, violin plots, histograms, scatter plots, Q–Q plots, stem-and-leaf displays and pie charts from pasted or uploaded datasets.It computes five-number summaries, flags outliers using Tukey IQR fences with adjustable sensitivity (1.5×, 2×, 3×) and offers jitter, mean and notch overlays.
Compare up to 10 datasets side-by-side with independent colors, notch displays and scatter overlays for group comparison and distribution analysis.
One-click export options (PNG, SVG, CSV, XLSX, HTML, Markdown) deliver publication-ready, watermark-free charts and data tables.Client-side computation runs entirely in the browser so data remains local and private.
Built-in AI analysis produces statistical summaries, distribution insights and custom visualization suggestions.The responsive interface requires no installation, accepts pasted numbers or files, and supports high-resolution exports for reports and presentations.
Key Features
Use Cases
Who is it for?
Compare up to 10 datasets side-by-side with independent colors, notch displays and scatter overlays for group comparison and distribution analysis.
One-click export options (PNG, SVG, CSV, XLSX, HTML, Markdown) deliver publication-ready, watermark-free charts and data tables.Client-side computation runs entirely in the browser so data remains local and private.
Built-in AI analysis produces statistical summaries, distribution insights and custom visualization suggestions.The responsive interface requires no installation, accepts pasted numbers or files, and supports high-resolution exports for reports and presentations.
Key Features
- Generates box-and-whisker, violin, histogram, scatter, Q–Q, stem-and-leaf and pie charts from pasted or uploaded datasets
- Computes five-number summaries and detects outliers using adjustable Tukey IQR fences (with jitter, mean and notch overlay options)
- Compares up to 10 datasets side-by-side with independent colors and overlay options (notch and scatter)
- One-click exports to PNG, SVG, CSV, XLSX, HTML and Markdown with high-resolution output
- Client-side, in-browser computation with a responsive no-install interface and built-in AI analysis for statistical summaries and visualization suggestions
Use Cases
- Create publication-quality box-and-whisker, violin and scatter plots from pasted or uploaded data using the browser-based plot generator, export high-resolution charts for figures and presentations, and rely on built-in AI statistical summaries and Tukey IQR outlier flags to document methods and support results
- Develop classroom assignments and interactive demonstrations by generating histograms, Q–Q and stem-and-leaf plots from student datasets, use five-number summaries and AI-driven explanations to teach interpretation, and keep sensitive student data private with client-side processing
- Create fast data-quality and exploratory pipelines for analysts by comparing multiple datasets side-by-side, automatically flagging Tukey outliers and summarizing differences with AI-driven statistics, then export visuals for stakeholder reports without uploading data off the browser
Who is it for?
- Data analysts
- Researchers
- Statisticians
- Teachers
- Business analysts
No review yet!
More Data visualization AI Tools
Explore other data visualization tools with user ratings, pricing details, and in-depth descriptions. Updated regularly by our editorial team.